Making google maps
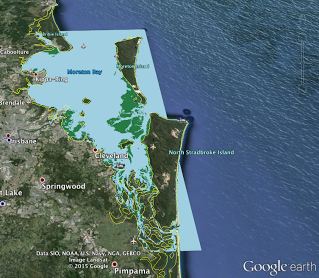
One of the fun things you can do with maps in R is make rasters and shapes that plot on Google Earth. All you really need to do is convert your spatial data to lon-lat coordinates then use one of the KML packages to save the layer as a KML, which can then be viewed in Google Earth. Here is a screen shot of an example from data in my R spatial course.
Here is how to do it for a raster.
Here we export the seagrass raster data (available here)
from my R Spatial Course as KML. You will need the plotKML
package
and its dependencies.
First up load the data
library(raster)
library(rgdal)
library(plotKML)
rseagrass <- raster('raster seagrass.grd')
Then convert to lon-lat
rsg.ll <- projectRaster(rseagrass, crs = "+proj=longlat +ellps=WGS84", method = 'ngb')
We are using the nearest neighbour ('ngb') interpolation here, because the seagrass raster is categorical (0/1 for absence/presence of seagrass).
Finally pick some colours and save as a KML
sgcols <- c('lightblue', 'seagreen')
KML(rsg.ll, 'Seagrass_MoretonBay', col = sgcols)