Twitter stats from the International Coral Reef Symposium
A few people have asked me about statistics on tweets at the International Coral Reef Symposium. You can actually download all tweets that match a certain search term and analyse them using R. I used the twitteR package to access tweets that mention the hashtag #ICRS2016 (via a custom app created in my twitter account) .
There were a very large number of tweets, so I limited the date range from 18th June until 25th June.
I then ran some analyses. Here are the results.
Over the period 18-25 June there were 14 246 tweets and re-tweets of which 5860 were original tweets. There were 1938 unique handles (ie people) tweeting to #ICRS2016.
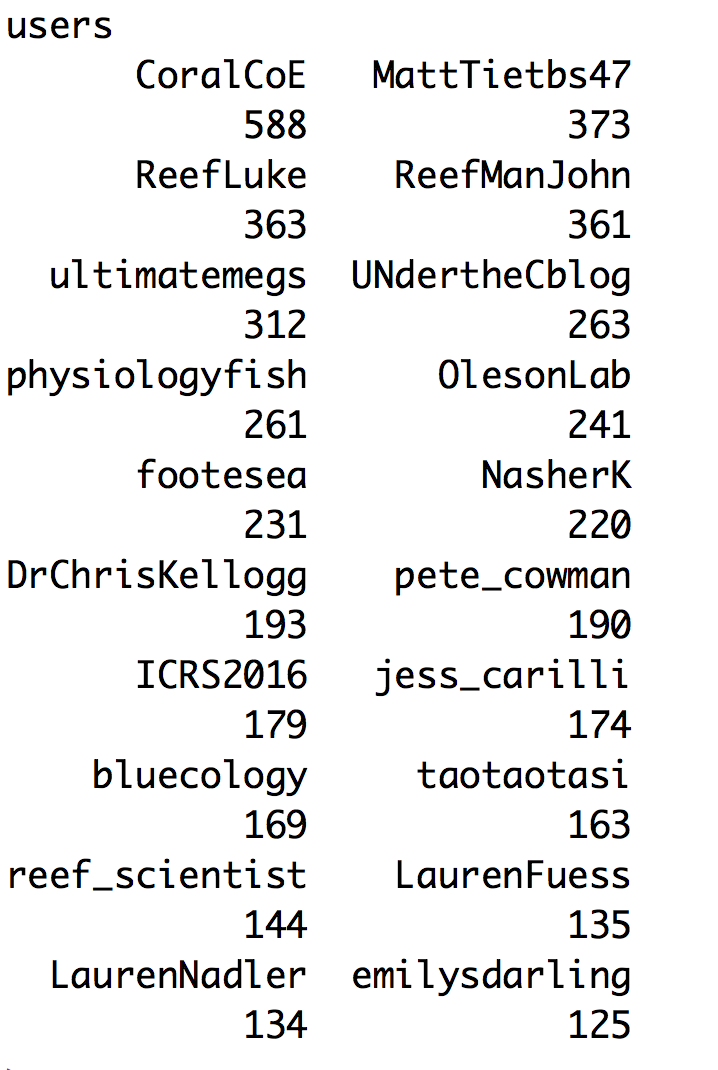
The top tweeters are pictured below, including the number of tweets and RTs they made:
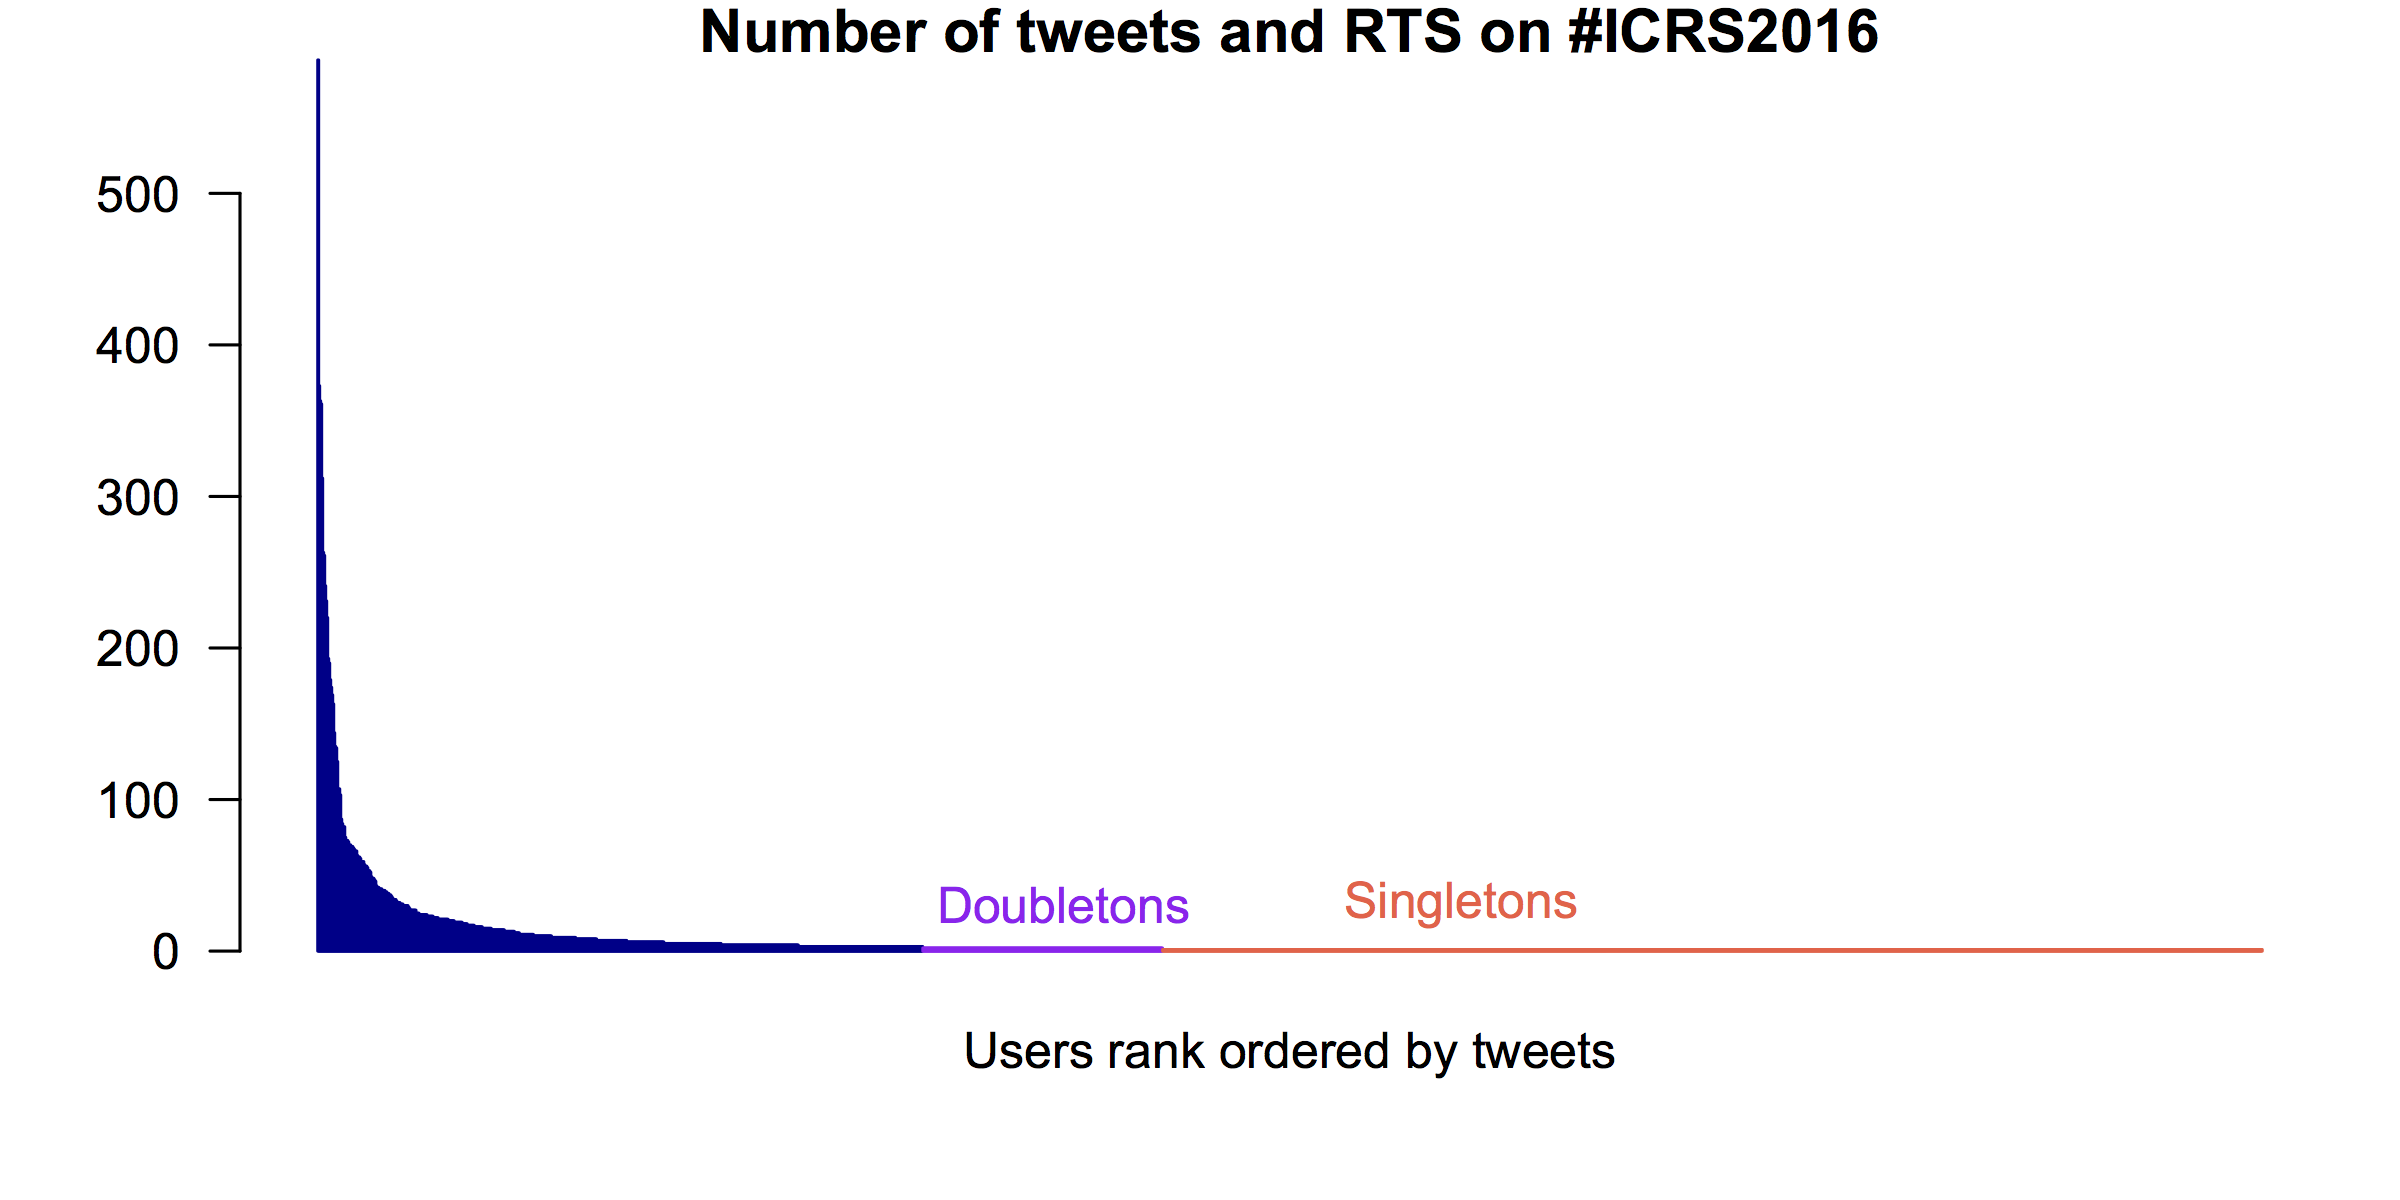
It was not possible to determine how many of the handles were actually at the conference, because most were not geo-tagged. Most handles only participated by retweeting something once. In fact the tweet-frequency curve looked something like the species-abundance distribution from Nancy Knowlton’s talk about rare invertebrate species on reefs:
Prof. Terry Hughes had the honour of the most retweeted tweet, with 111 retweets:
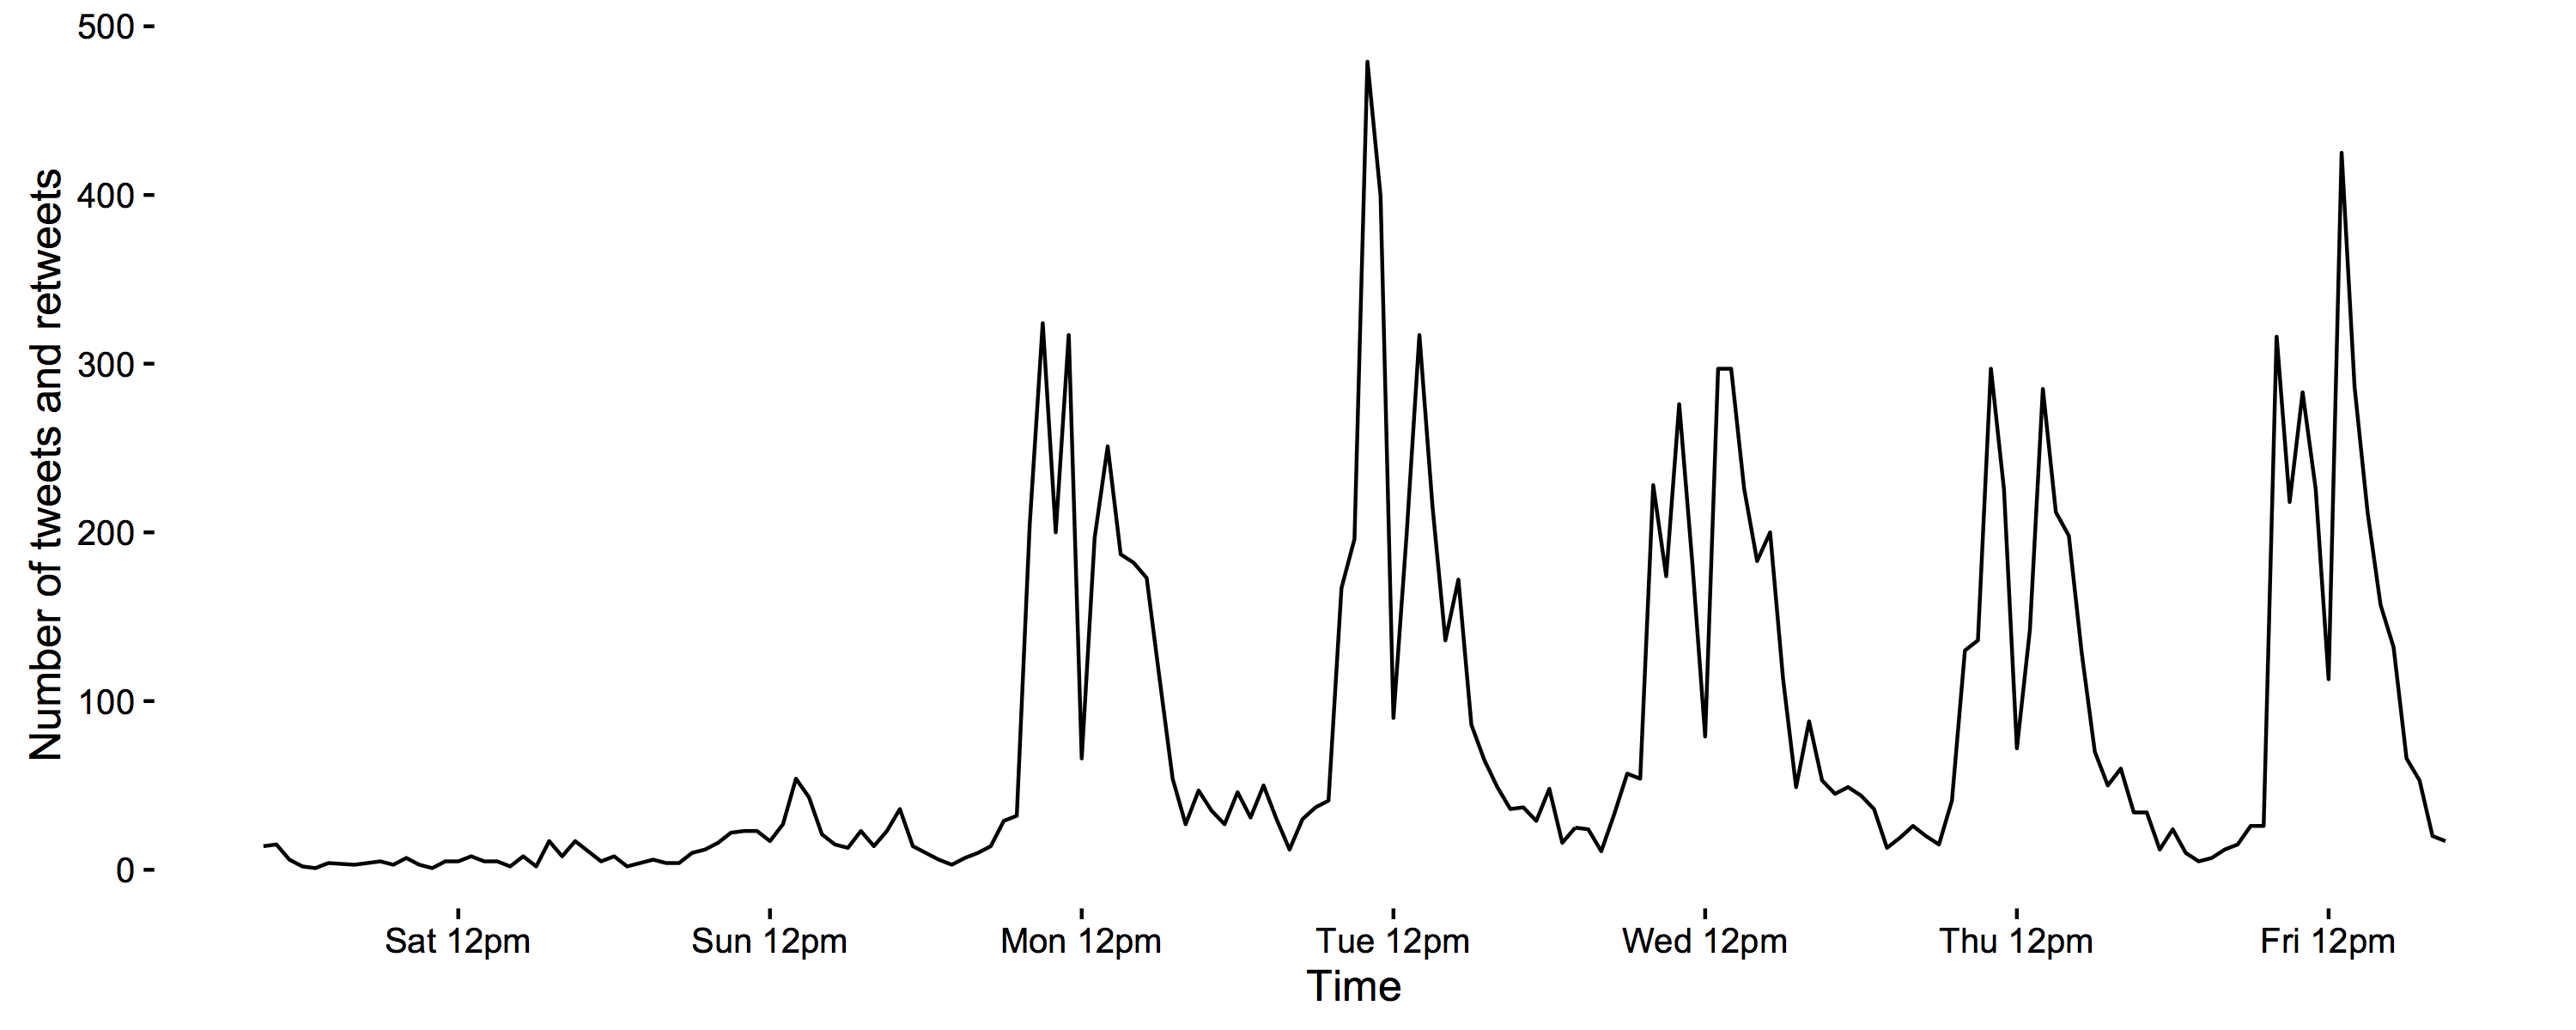
 A plot of the tweet and RT time-series shows distinct peaks during mornings and afternoons at the conference, with a break at lunch time and during the night: