How to inset a plot on another plot in R
The difficulty of plotting one plot over the top of another in R has always frustrated me. I often end up opening some photo editing software (like Gimp, which is free) and doing it manually. However, manual editing can be frustrating if you need to change the plot.
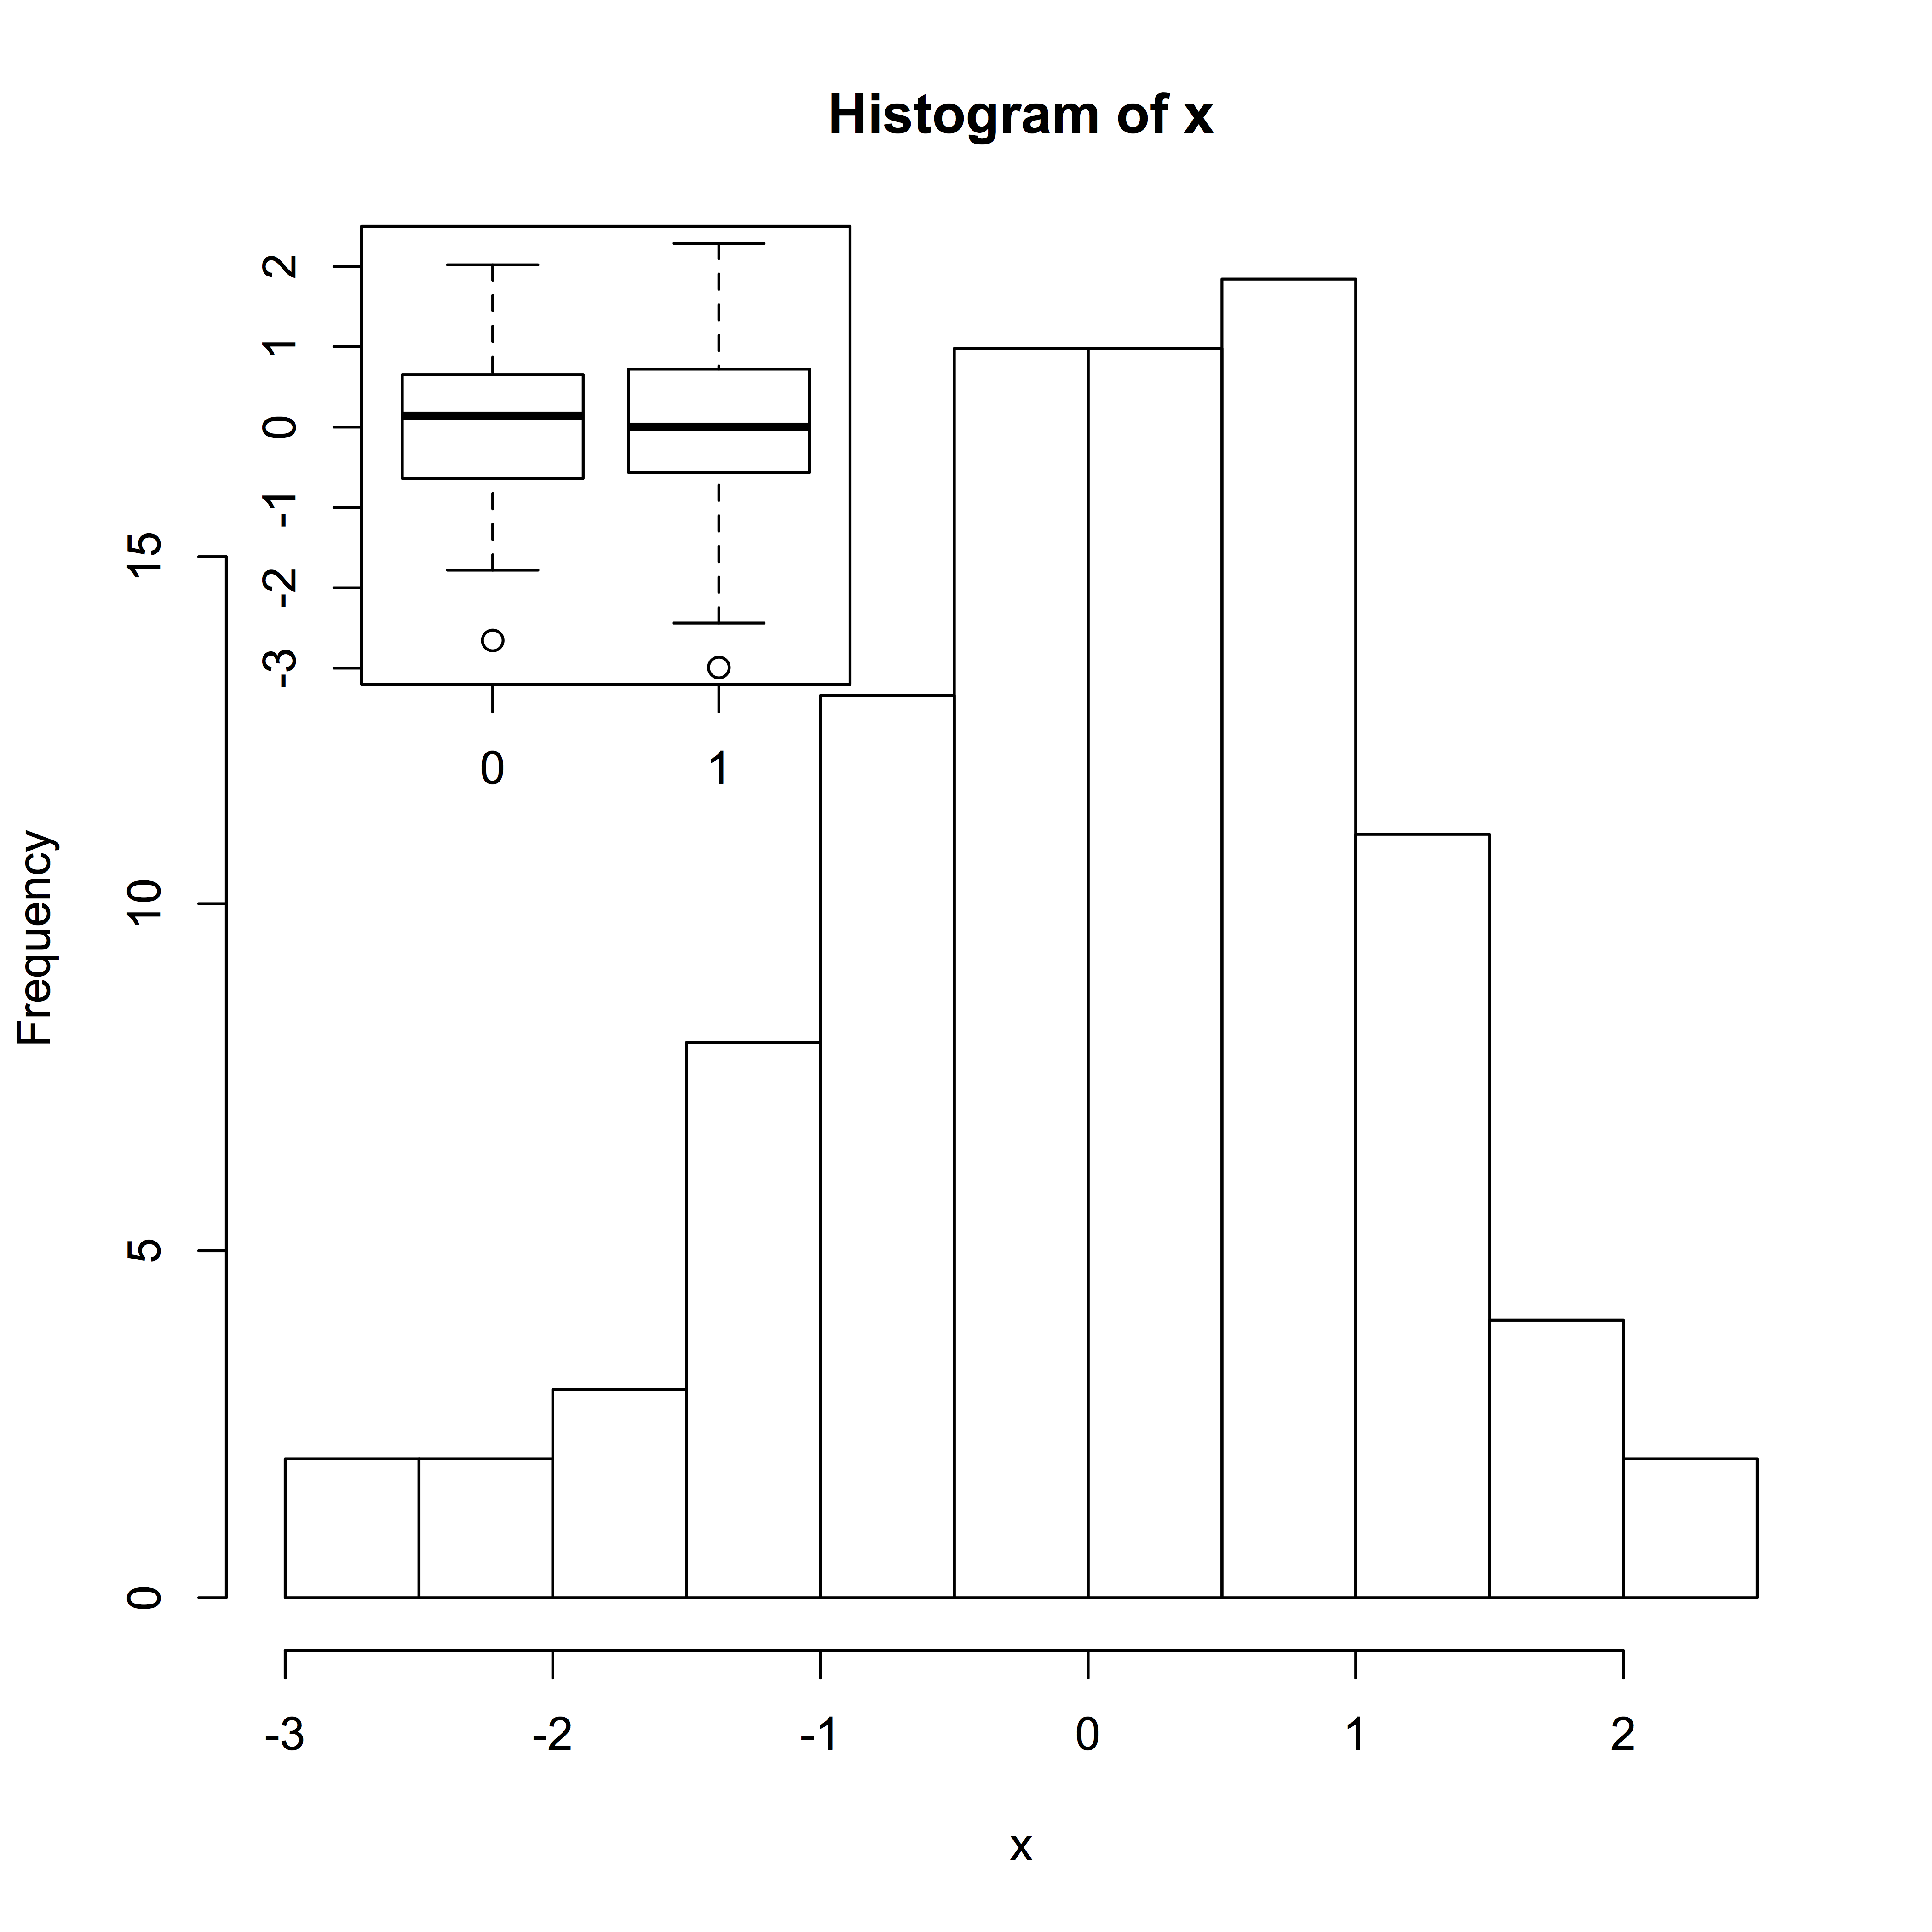
A histogram with a boxplot inset
I just learned a hassle free way to create insets (thanks to Ben Stewart-Koster) and wanted to share it, so here it is:
First, let’s simulate some fake data
x <- rnorm(100)
y <- rbinom(100, 1, 0.5)
Now the key step, use par to set the fig param to your desired coordinate space. e.g. in the below we can specify figures positions in 0-1 on both the x and y coordinates:
par(fig = c(0,1,0,1))
Now plot your first figure
hist(x)
Now the second key part, specify where in the coordinate space you want your inset figure to go:
par(fig = c(0.07,0.5, 0.5, 1), new = T)
boxplot(x ~ y)
Voila that is it, we have our figure with an inset.