library(tidyverse)
library(readr)

dat <- read_csv(url("https://raw.githubusercontent.com/cbrown5/example-ecological-data/refs/heads/main/data/benthic-reefs-and-fish/fish-coral-cover-sites.csv"))

head(dat)
summary(dat)7 AI powered analysis
Now you are familiar with some of the software options, let’s look at how to use these tools in AI powered analysis workflows and some best practice prompting guidelines.
For the examples here we’ll use the benthic survey data, so make sure you’ve set up a project and have that data loaded:
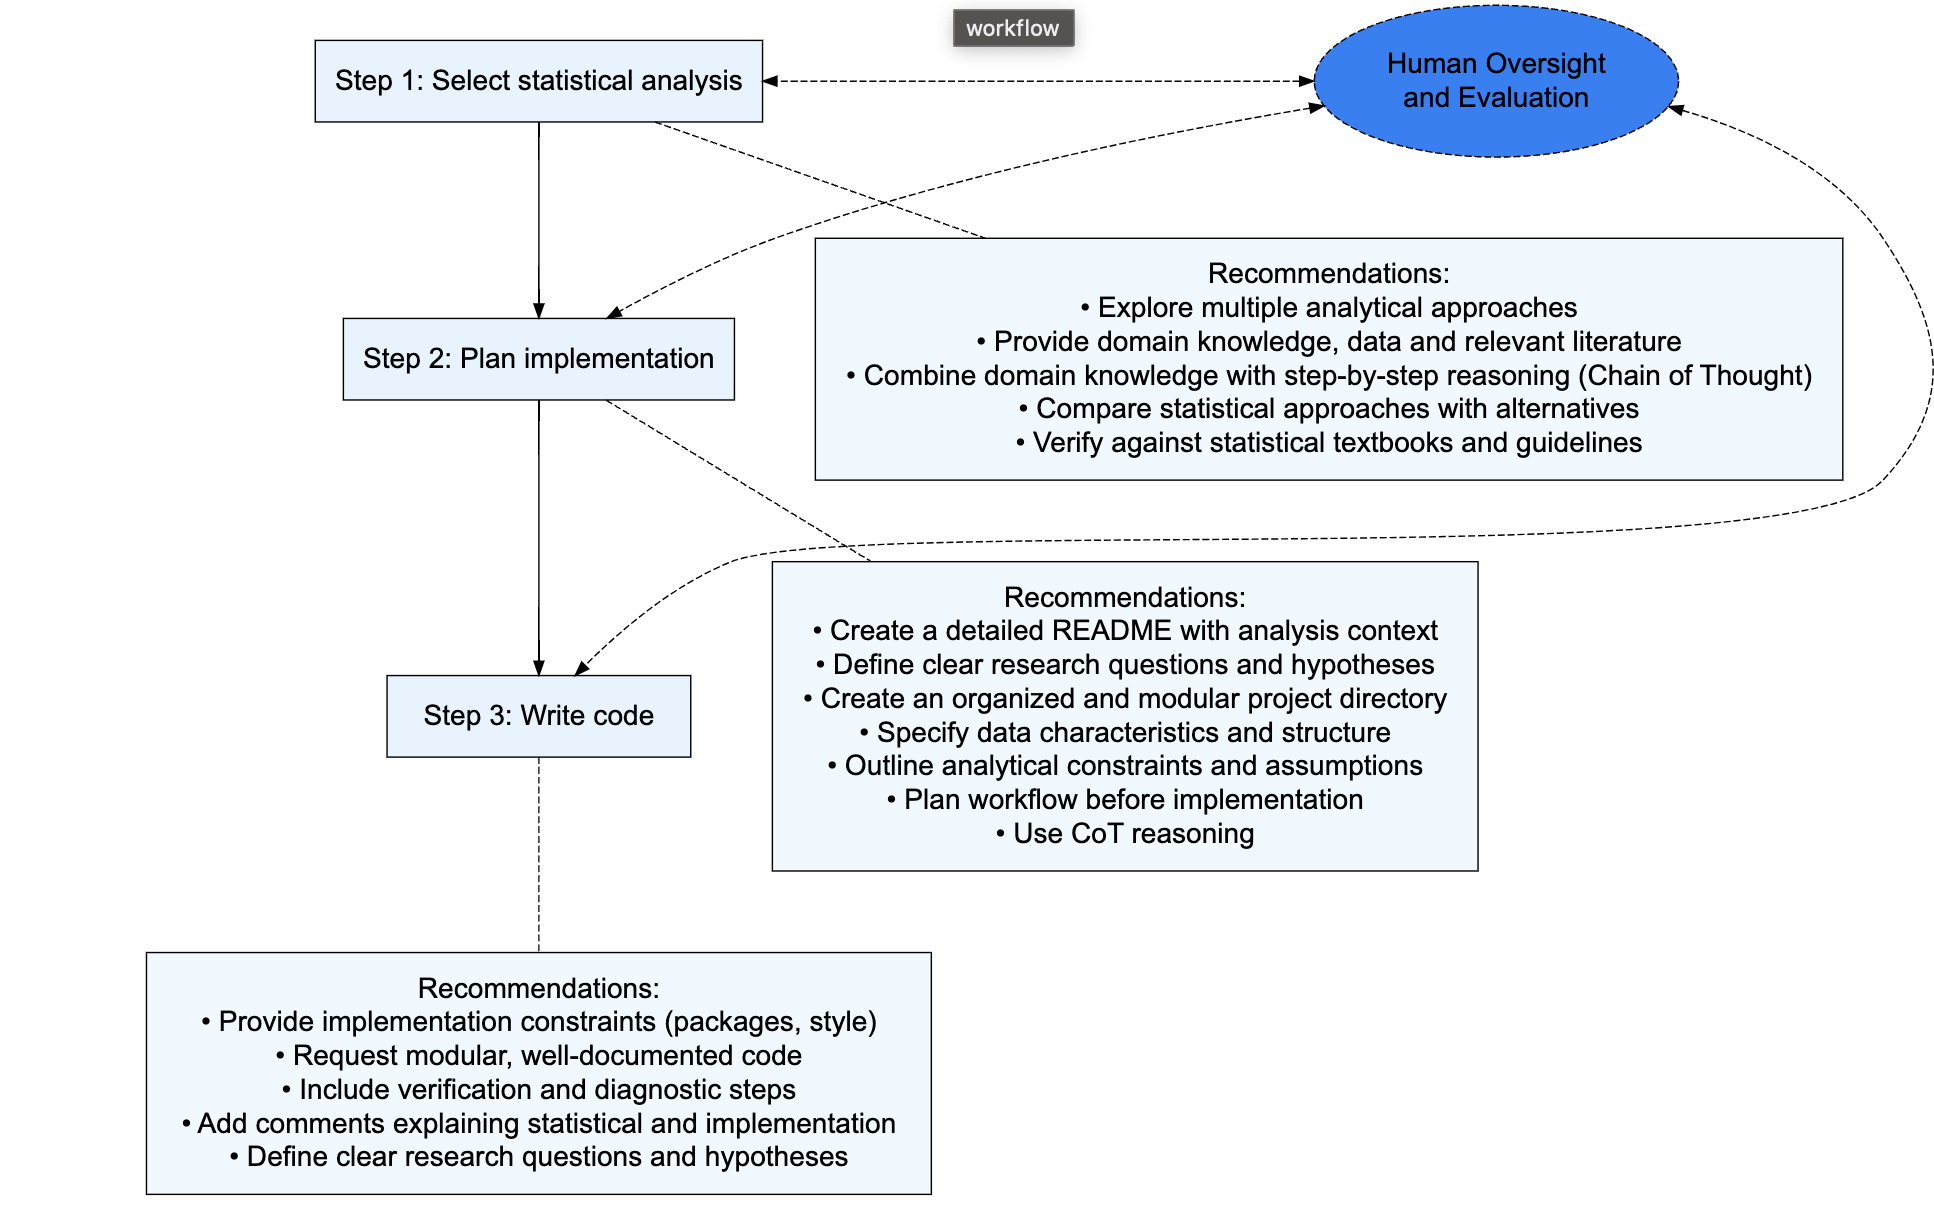
7.1 Recommended data analysis workflow
LLM prompting is most effectively designed if you have a good idea of your goal and the workflow or process that needs to be followed to achieve that goal.
Remember the basic advice was to break problems into smaller parts. So for data analysis I suggest thinking about different stages in your workflow. Here’s one suggestion:
- Select statistical approach: Determining appropriate statistical methods for research questions
- Plan implementation: Designing the analytical workflow and code structure
- Write code: Writing the actual code to implement analyses
- Guidance on Interpretation: Understanding and reporting results
LLMs perform differently across these components. They excel at code generation and implementation planning but are less reliable for selecting appropriate statistical approaches or interpreting complex results.
LLMs can be used across all of these steps, but we recommend that each step is treated separately. This encourages informed decision making and avoids making decisions on the fly. For instance, it is better to design the statistical analysis prior to setting an agent up to automate the implementation of that analysis.
The separation of workflow steps also helps prevent overreliance on LLMs for statistical decisions.
7.2 Stages of analysis
Now let’s work through applying that general advice to specific the stages of analysis I identified.
7.3 Selecting a statistical method
Its good practice to identify the analysis you want to do, before thinking about how you write the code for that. Once you have an approach, follow-up with identifying what packages can implement that approach.
The limited number of evaluations of LLMs for statistics have found the biggest improvements for prompts that:
- Include domain knowledge in the prompt
- Include data or summary data in the prompt
- Combine domain knowledge with CoT (but CoT on its own doesn’t help)
In addition, larger and more up-to-date models tend to be better. e.g. try Claude 4.0 or GPT 5.
Tip: LLMs will tend to suggest the most obvious statistical analyses. If you want to innovate creative new types of analyses you need to work a bit harder. One way to do this is to mix up your prompts to try and get cross-disciplinary pollination. For instance, you could ask it: “Suggest methods I could use for this analysis, taking inspiriation from different disciplines such as medicine, psychology and climate research”.
7.3.1 Giving context
As we saw above its a good idea to give the assistant context on your data, data collection methodology and aims. I recommend writing a markdown document with all of this information in it. Here’s an example for the analysis of my benthic project. The markdown is easy to attach to any request you make to an assistant, or copy and paste into web forms.
You can of course use the assistant to create the markdown. Try this in agent mode:
NotePrompt
Write a summary of the meta-data for this database in a new markdown file [attach the csv database]
Then you can edit the summary to ensure it is accurate.
7.3.2 Attaching data or data summaries
Attaching the data is proven to improve the accuracy of statistical recommendations.
Attaching data works a lot like giving context. The LLM can see what the data looks like and can often guess variable types from the data field names or data values.
Large datasets can be hard to attach, because they fill up the context window. GC agent mode will automatically shorten large data frames if you attach them.
Or ask the agent to write a script to create a data summary. For instance try this in agent mode:
NotePrompt
Write a script that creates smaller version of the benthic data that has only the first six rows of data
Tip: If you consult a human statistician they’ll usually ask you lots of questions. LLMs, in contrastwill tend to just give you an answer, whether or not they have enough context. Say you asked me the same question you had in your LLM prompt like “how do see if fish are related to coral”. There’s no way I’d jump in with an answer with so little information. But the LLM will. So be aware of this shortcoming and come to prompting pre-prepared with the context it will need to give you a better answer.
7.3.3 Attach domain knowledge
Domain knowledge is proven to improve the accuracy of statistical recommendations.
Domain knowledge on the research question and relevant statistics can really help refine your approach. If you have a paper that you are emulating, convert it to markdown so you can attach that as context to the prompt (e.g. from a url or pdf).
Other good sources of domain knowledge are stats tutorial blogs, package documentation and the R package vignettes. So keep a list of these handy for when you need them.
Google’s LLM notebook is another popular tool for this. Create a notebook, attach your sources and then ask for a summary. You can then feed this into your project specific AI assistant as domain knowledge.
7.3.4 Web search
AI web search tools can help you create customized tutorials for your stats problem. You can then attach these as context when discussing your project with the assistant. See the ?sec-deepresearch for how to use API calls to do this. Many AI web platforms also have web search features, including chatGPT and copilot. Google is in the process of adding this option to its search engine.
You’ll get the best results if reasoning/thinking modes are enabled. As these are more energy expensive to run they are often only available for paid subscriptions. Make sure you read the reasoning information as well, as its important to understand if the answer is of high quality or not.
Remember that web search AI doesn’t like long prompts, so keep your prompts short and specific.
Here’s a prompt you can try in chatGPT or Copilot (e.g. in Teams):
NotePrompt
Research the peer-reviewed academic literature to find the most robust methods for analysing ecological count data.
7.4 Plan implementation and project structure
Repeat after me:
I will keep my data analysis code neat and organized. I will keep my data analysis code neat and organized. I will keep my data analysis code neat and organized.
If you’re like most of us, you probably code as you go and don’t spend a lot of time organizing what you’ve created. You may end up with a script that’s 1000s of lines long and spans data import, wrangling, initial visuals, analysis, verification and plotting.
The worst cases I’ve seen are scripts that don’t even evaluate in order, like students who tell me ‘run lines 60-70, then go back to line 20 and it should work…’
Have you ever tried to go back into one of your old projects to fix something and found it a massive mental struggle to work out what you did? Well that is a problem for the AI assistant too. You’re filling its context window up with irrelevant junk and its going to have a hard time giving you good advice.
Organized code is good for future you, its good for other scientists using your code, its good for repeatability AND its good for getting better help from AI assistants.
Its more work to do, but the good news is that the time cost is more than made up with the time savings from using the AI. The AI can even help you be more organized.
So my next step is to plan what you do, before you do it. This means thinking about the high level steps you’ll have to go through to complete your analysis.
7.4.1 Directory structure
There’s no single way to organize your project, the main thing is to be organized. I keep a folder on my computer with a template. Inside that folder I have these files and directories:
glm-test-case/
├──  readme.md           # This readme file with project documentation
├──  .gitignore           # Standard gitignore for R projects
├──  LICENSE
├── data/                    # Data files and intermediate datasets
├── initial-prompt.md       # Initial project prompt and requirements
├── outputs/                # Generated output files
│   └── plots/              # Diagnostic plots and visualization outputs (PNG files)
└── scripts/                # R scripts for data analysis and modeling
You might want to add more nesting if it’s a complex project, such as project with both spatial and non-spatial databases.
7.4.2 Readme file for the assistant (and you)
Here’s an example from my readme file, which gives instructions for the agent for how to structure and navigate the project.
It is helpful to be specific about:
- Folder structure
- Variable names and meta-data
- Code organisation
- Code style
Here’s an example from one of my readme files that has the above elements.
NotePrompt
7.5 Instructions for AI agent
The agent will produce a report that answers the above questions. The report will include a description of the data, the methods used for analysis, and the results of the analysis. The code will be written as R scripts.
Each script should be modular and save intermediate results as datafiles and figures. The final report must be written in Rmarkdown format. The figures will be imported using markdown syntax, e.g. . Don’t use R code for figures in the markdown report. Summary tables should be imported from .csv files and created using the knitr::kable() function in Rmarkdown. The report must include the following sections:
- Study aims
- Data methodology
- Analysis methodology
- Results
- Model selection and verification
- Model fit statistics
- Plots of predicted fish abundance (log-link scale) based on the final model, with confidence intervals
- Relevant statistics (r2, p-values, etc.)
The agent is must produce diagnostic plots and a separate report on the model diagnostics.
7.5.1 Tech context
- We will use the R program
- tidyverse packages for data manipulation
- ggplot2 for data visualization
- use
theme_set(theme_classic())for plots - Use the
MASSpackage for the negative binomial model, however don’t load it globally withlibrary(MASS), instead useMASS::glm.nb()to avoid namespace conflicts. - Use
visregpackage for plotting model effects and confidence intervals, e.g.visreg::visreg(m2, "CB_cover", "soft_cover", gg=TRUE, scale = 'linear')
Keep your scripts short and modular to facilitate debugging. Don’t complete all of the steps below in one script. Finish scripts where it makes sense and save intermediate datasets.
When using Rscript to run R scripts in terminal put quotes around the file, e.g. Rscript "1_model.R"
7.5.2 Workflow
- Create a todo list and keep track of progress
- Data processing including standardizing coral variables by number of points
- Model selection and verification, produce diagnostic plots
- Model diagnostic plots markdown report
- Create plots of predictions from the final model
- Write report in markdown format
7.5.3 Directory structure
glm-test-case/
├── data/                    # Processed data files and intermediate datasets
├── fish-coral.csv          # Raw data file with fish and coral cover measurements
├── glm-readme.md           # This readme file with project documentation
├── initial-prompt.md       # Initial project prompt and requirements
├── outputs/                # Generated output files
│   └── plots/              # Diagnostic plots and visualization outputs (PNG files)
└── scripts/                # R scripts for data analysis and modeling
Put the .rmd reports in the top-level directory.
Have a go at writing your own readme file, then using an assistant to complete the analysis. You will also want to include meta-data and project aims. You can pick your own project aims, but one example might be a project that aims to test if fish abundance depends on coral cover.
Once you have your readme, you can attach it (or open it then click new chat). Given all the context you’ve provided you can just write something simple like:
NotePrompt
Help me plan R code to implement this analysis.
Or
NotePrompt
Help me plan the workflow and scripts to implement this analysis
7.6 Writing the code
Once you’re happy with the plan, you can get copilot to implement it. There’s roughly three ways to do this, with increasing levels of automation
- Start creating the code yourself, using inline editing and copilot edit to help write bits of the code
- Instruct an AI agent to complete the tasks in the readme, manually checking in and editing the code as you go. See the Agents chapter for more on AI Agents.
- Full ‘vibe-coding’ which means you ask an AI agent to complete the task and just accept all of its suggestions.
Vibe coding isn’t recommended for scientific projects, more on that later.
Tip: We are using the readme.md is copilot’s memory. This means the assitant always has the context it needs across different chat sessions (where it would otherwise forget). So its important to keep the readme updated. Its also useful to help you remember if you come back to the project some months or years later.
A few more tips for this stage of the analysis.
As you go attach datasets or domain knowledge as neccessary, particularly if the assistant can’t access that information from your readme.
You can get the assistant to write tests for your datasets. Such as checking joins worked properly and you didn’t duplicate or lose data.
7.7 Suggested workflows
7.7.1 Suggested workflow for new analyses
Here’s a workflow I’ve found works well if I’m doing an analysis that is new to means
Read the literature to identify the appropriate analysis for the research question and data.
Once I’ve narrowed down the options I look for useful domain knowledge: vignettes, manuals or blogs that have suitable R examples.
Start a new folder, setting up the directory and readme as descriped in this workshop.
Use copilot to implement the analysis, attaching data summaries and the domain knowledge to get the best prompts.
7.7.1.1 Suggested workflow for analyses I know well
Much the same as above, just less planning and you don’t need to search the literature because you know what you want to do. If you save useful domain knowledge when you see it you will also have the documents on hand to support the assistant.
7.7.2 Iterating
Ecological modelling is a creative art with rules. The rules are the scientific method, the medium is math, logic and code. You can view AI as part of this creative scientific process, rather than a replacement for the human.
Use an LLM assistant to create multiple complete versions of your project. You can then compare them to get ideas. You can also continuously refine the prompt to get what you want as you go.
Add it as a tool in your belt, not a replacement. Talking to colleagues, reading, sitting on a board looking at the ocean, having showers etc… are all still important.