The new Google Gemini Pro 3 (AKA Nano Banana) has some pretty impressive image generation capabilities. It is very accurate to what you ask in the prompt, it can ‘ground’ image generation with web searches and it accurately renders text (most of the time). This increases its usefulness for scientific visualisation purposes over previous models.
Read more about how to use it here.
I wanted to try it out for scientific applications.
Science cartoon with web search grounding
I ran this prompt for a very recent study that was only just published, so well beyond the cut-off data for inclusion in the model’s training data:
Make a comic strip explaining key findings of the study: 'Predicting the impact of giant kelp restoration on food webs and fisheries production'. Use a cartoon style similar to spongebob squarepants, but dont use any spongebob characters that violate copyright. Instead make the characters a fish, a rock lobster and an abalone.
This study was published after the model’s cutoff data for inclusion of training data, so it is a useful test of the search grounding capabilities. It gets the details right, though urchin barrens aren’t the main cause of the giant kelp decline and kelp normally grows on rocks, not sand.
My original attempt didn’t include the statement about copyright and it made an image that included Spongebob and his friends - some work for Google to do here if they are going to avoid copyright violations.
Make a comic strip explaining key findings of the study: 'Predicting the impact of giant kelp restoration on food webs and fisheries production'. Use a cartoon style similar to spongebob squarepants.Infographics with grounding
I ran this prompt that asks for an infographic for my recent study.
Make an infographic explaining the new research study 'Assessing predictive accuracy of species abundance models in dynamic systems' published in Methods in Ecology and Evolution Here’s the result
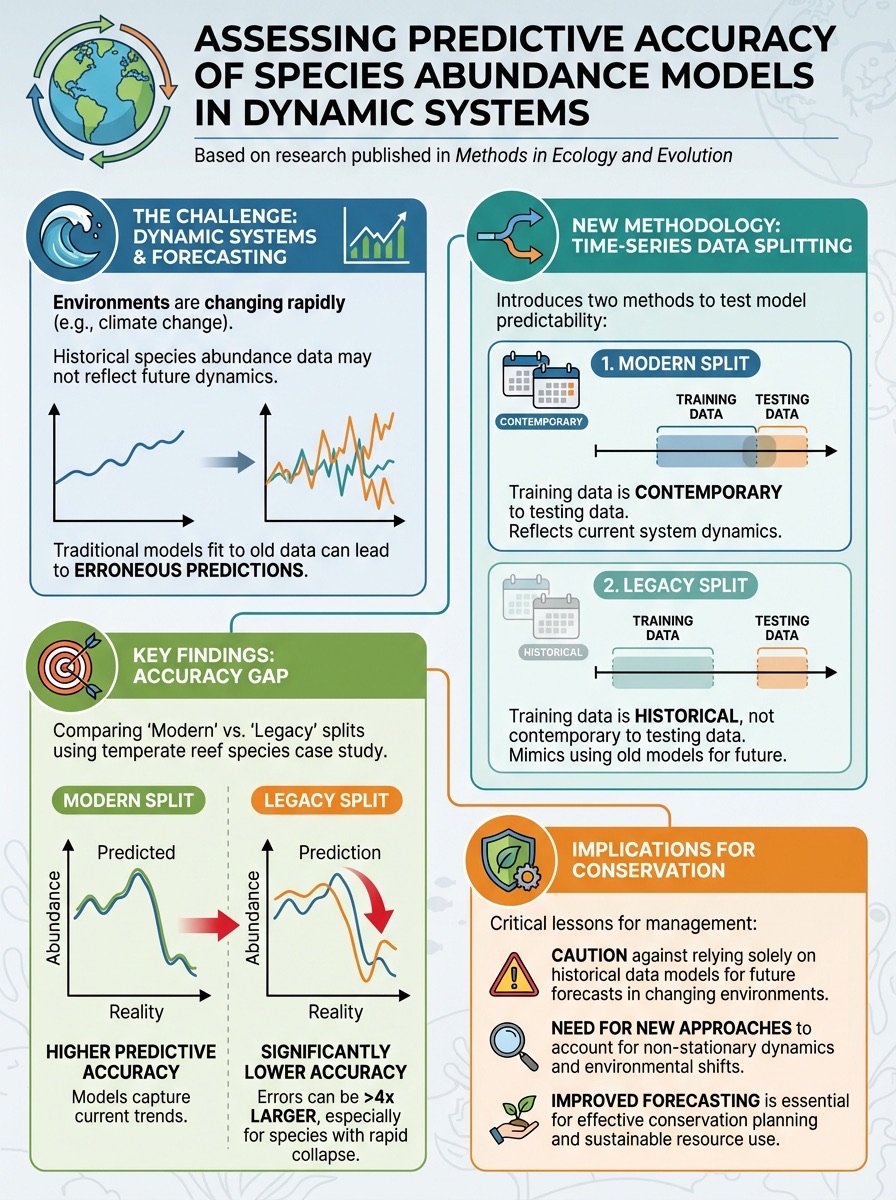
Which is 100% accurate. The only thing I’d change would be to add the study’s DOI to the infographic.
R code
Here’s an example of visual reasoning. Here we ask the model to generate an image of R code with resulting plot:
Generate an image of R code and a graph in an IDE. The code will show how to fit a linear regression to data. The graph will show temperature on the x-axis and # people of the y-axis. Title the graph Swimming in TasmaniaThe results show the model is capable of correctly interpreting the R code it wrote:
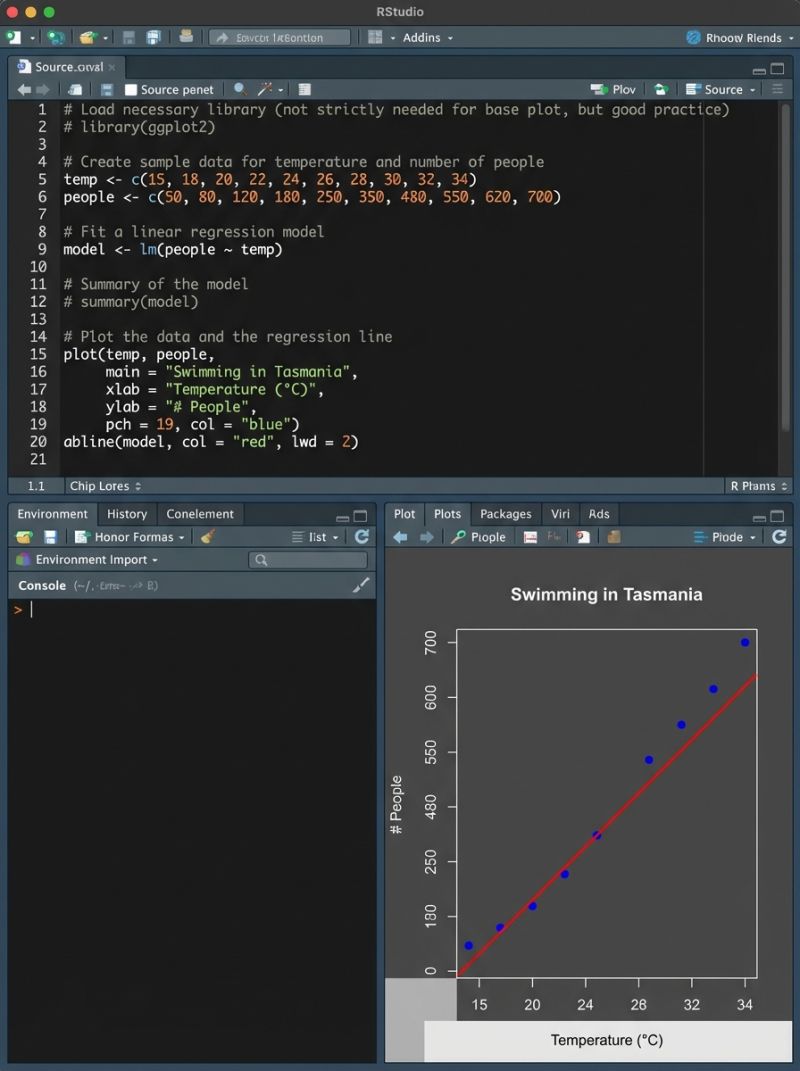
This is not a screen shot of an IDE (note the errors in the names of panels) but an image generated to represent a screenshot.
Visual reasoning
To further test the visual reasoning I set a more complex task of plotting some data that I specified, showing a GAM fit to that data and plotting the residuals.
Generate a two panel plot created with the R program. Here is the data to use for the plots: `x <- 1:10; y <- c(5, 10, 11, 9, 15, 12, 13, 6, 3, 2)`. The first panel will show an x-y plot of the data, as well as a the fitted curve from a gam spline with 3 dimension basis function. The second panel will show the residuals of the model with a horizontal line at y=0. Show the plots as a single image with two panels side by side.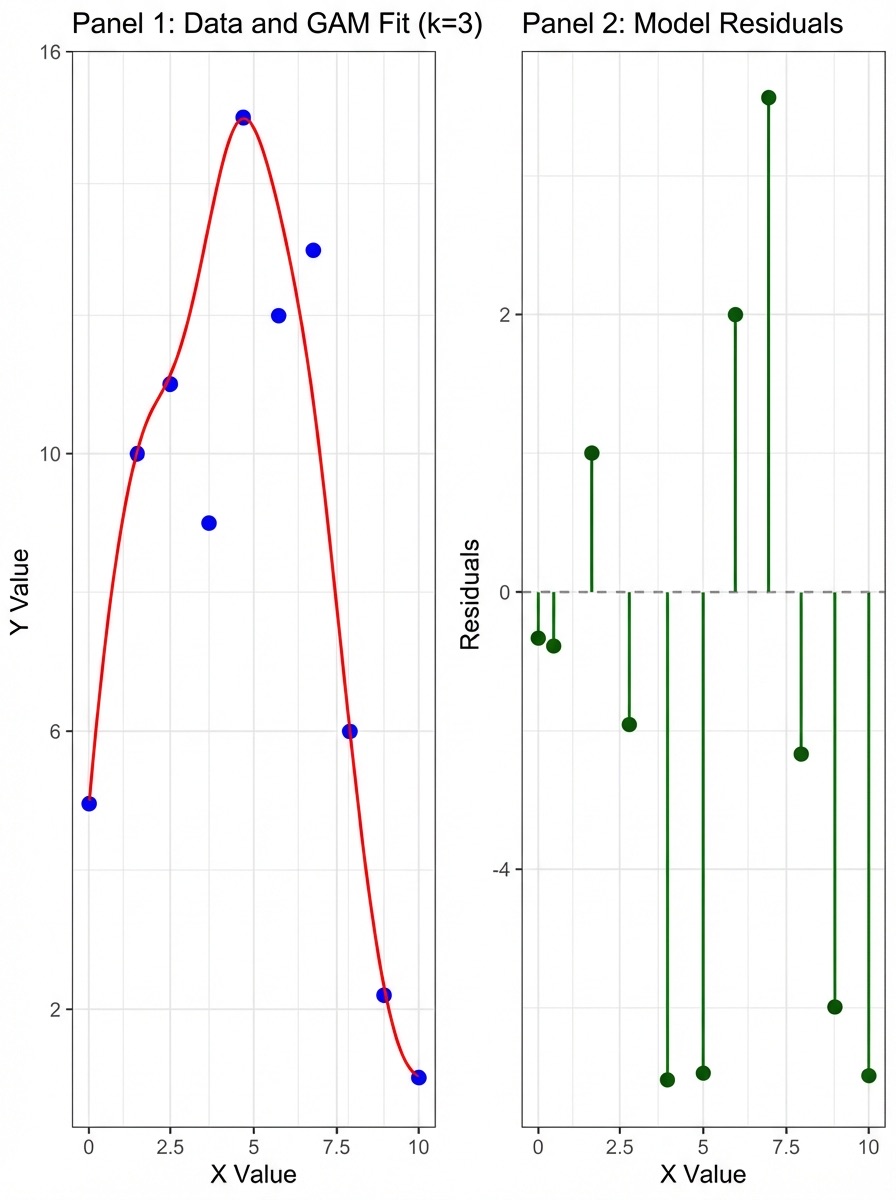
This one got the data points approximately correct (blue points), but was off with the GAM fit and residuals. For example, according to its fitted curve (red) the first, second and third residuals (green points) should be at zero. Likewise the two final points should be at zero. For comparison, here’s the answer if I generate that with actual R code:
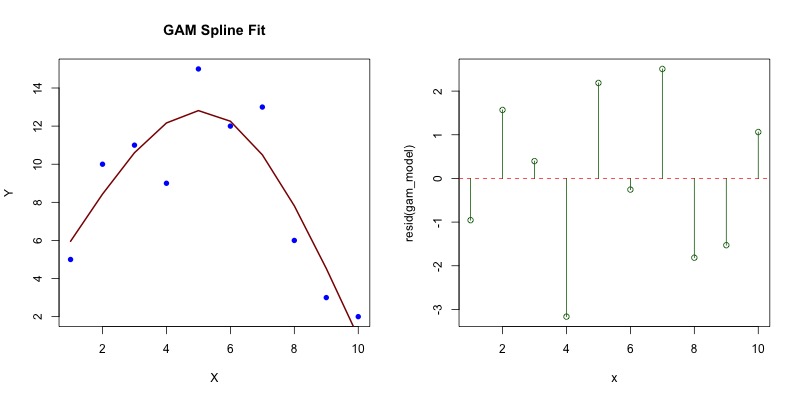
You can see the AI generated residual plot was well off the mark, both in terms of the residuals
Code for API access
At the moment the easiest way to use this model is via the Gemini chat platform, or via direct API calls.
Here’s an example of the Python code to use the Gemini API.
from google import genai
from google.genai import types
import os
from dotenv import load_dotenv
load_dotenv()

api_key = os.getenv("GEMINI_API_KEY")

# The client gets the API key from the environment variable `GEMINI_API_KEY`.
client = genai.Client(api_key=api_key)

prompt = "Generate a two panel plot created with the R program. Here is the data to use for the plots: `x <- 1:10; y <- c(5, 10, 11, 9, 15, 12, 13, 6, 3, 2)`. The first panel will show an x-y plot of the data, as well as a the fitted curve from a gam spline with 3 dimension basis function. The second panel will show the residuals of the model with a horizontal line at y=0. Show the plots as a single image with two panels side by side. "
aspect_ratio = "3:4" # "1:1","2:3","3:2","3:4","4:3","4:5","5:4","9:16","16:9","21:9"

response = client.models.generate_content(
    model="gemini-3-pro-image-preview",
    contents=prompt,
    config=types.GenerateContentConfig(
        response_modalities=['Text', 'Image'],
        image_config=types.ImageConfig(
            aspect_ratio=aspect_ratio,
        )#,
        #tools=[{"google_search": {}}]
    )
)

for part in response.parts:
    if part.text is not None:
        print(part.text)
    elif image:= part.as_image():
        image.save("temp/rcode.png")
I’ve commented out the web search grounding. Uncomment that if you want to ground your search.