Mean trophic levels of a genera from FishBase
How would you selectively aggregate observations using R? For instance, say you have a table of trophic level estimates by fish species, but many species are missing values. For those species missing a value, you want to assign them the mean for their genus. I recently saw a post from Trevor Branch saying he had figured out exactly how to do this.

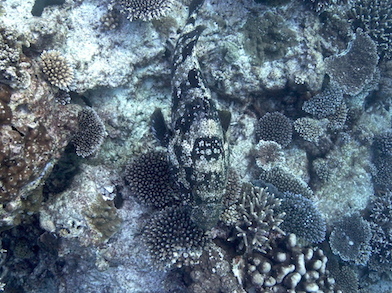
The well camoflaged Estuary Cod (Epinephelus malabaricus) doesn't have a diet based trophic level estimate on fishbase. One way to estimate it could be to assign it the mean for all Epinephelus
It got me thinking, what is the shortest way I could think of making this selective summary.
Here is my solution. I think it makes a nice lesson in using the dplyr
package.
First up we should load in the rfishbase package, which gives us
access to the FishBase API (“Application
Programming Interface”).
library(rfishbase)
library(dplyr)
To make this fast, we won’t do all fish species on Fish Base, but just
the groupers (family Serranidae). Let’s find out their species names and
make a new variable gensp that is the latin binomial (we will need
this later):
groupers <- fishbase %>% filter(Family == "Serranidae") %>%
  mutate(gensp = paste(Genus, Species))
nrow(groupers)

## [1] 537
If you haven’t seen the %>% ‘pipe’ symbol before, you had better look
up the dplyr vignettes. Its a convenient way to string multiple
commands together. So we now have a groupers data frame with a gensp
variable. We can access the trophic information from fishbase using the
ecology command:
grptroph <- ecology(groupers$gensp, fields = c("DietTroph"))
nrow(grptroph)

## [1] 233

head(grptroph)

##                    sciname StockCode DietTroph SpecCode
## 1 Acanthistius brasilianus        NA        NA      351
## 2      Acanthistius fuscus        NA        NA    59850
## 3      Acanthistius pictus        NA      4.23    57960
## 4       Aethaloperca rogaa        NA        NA     6441
## 5           Alphestes afer        NA      3.58     8726
## 6    Alphestes immaculatus        NA        NA     8727
ecology produces another dataframe (actually a tibble which is a
similar but not the same to a data.frame but it works well with
dplyr). Note that species with missing info are excluded from the
result, so we only have 233 grouper species now.
Note there is also a FoodTroph field, which is calculated slightly
differently. Check out the fishbase
manual
for more info.
Now just join our grptroph back go groupers so we get empty rows for
species with missing diet info:
d2 <- left_join(groupers, grptroph)
nrow(d2)

## [1] 537
Great, back to all 537 species.
Now the heart of my little program, produce a new dataframe d3 with a
new variable trophall. trophall will contain the species trophic
level if it has its own value and its genus mean trophic level if it doesn’t have
its own value (for some genera don’t have any measurements so get
NaN):
d3 <- d2 %>% group_by(Genus) %>%
  mutate(mntroph = mean(DietTroph, na.rm = T)) %>%
  ungroup() %>%
  mutate(trophall = ifelse(is.na(DietTroph), mntroph, DietTroph))
To step through this we:
-
Take
d2and group it by the variableGenus -
Calculate the mean of
DietTroph, removing missing values. The priorgroup_bycommand means we get the mean across species within each Genus. -
Ungroup, so further calculations (using
mutate) are not grouped by genus -
Calculate
trophallby assigning the genera mean if a species had a missing value inDietTrophand keeping the valueDietTrophif the species value wasn’t missing.
Let’s check the result:
d3 %>% select(Genus, Species, DietTroph, trophall) %>%
    data.frame() %>% head(20)

##            Genus       Species DietTroph trophall
## 1   Acanthistius   brasilianus        NA     4.23
## 2   Acanthistius       cinctus        NA     4.23
## 3   Acanthistius        fuscus        NA     4.23
## 4   Acanthistius        joanae        NA     4.23
## 5   Acanthistius     ocellatus        NA     4.23
## 6   Acanthistius    pardalotus        NA     4.23
## 7   Acanthistius  patachonicus        NA     4.23
## 8   Acanthistius       paxtoni        NA     4.23
## 9   Acanthistius        pictus      4.23     4.23
## 10  Acanthistius   sebastoides        NA     4.23
## 11  Acanthistius      serratus        NA     4.23
## 12  Aethaloperca         rogaa        NA      NaN
## 13     Alphestes          afer      3.58     3.58
## 14     Alphestes   immaculatus        NA     3.58
## 15     Alphestes multiguttatus        NA     3.58
## 16 Anatolanthias    apiomycter        NA      NaN
## 17       Anthias       anthias        NA      NaN
## 18       Anthias asperilinguis        NA      NaN
## 19       Anthias   cyprinoides        NA      NaN
## 20       Anthias    helenensis        NA      NaN
Finally, let’s find out what our Estuary cod gets:
d3 %>% filter(gensp == "Epinephelus malabaricus") %>% select(trophall)

## # A tibble: 1 × 1
##   trophall
##      <dbl>
## 1     3.89
That’s how I would solve Trevor’s problem. Let me know if you have a more elegant way.